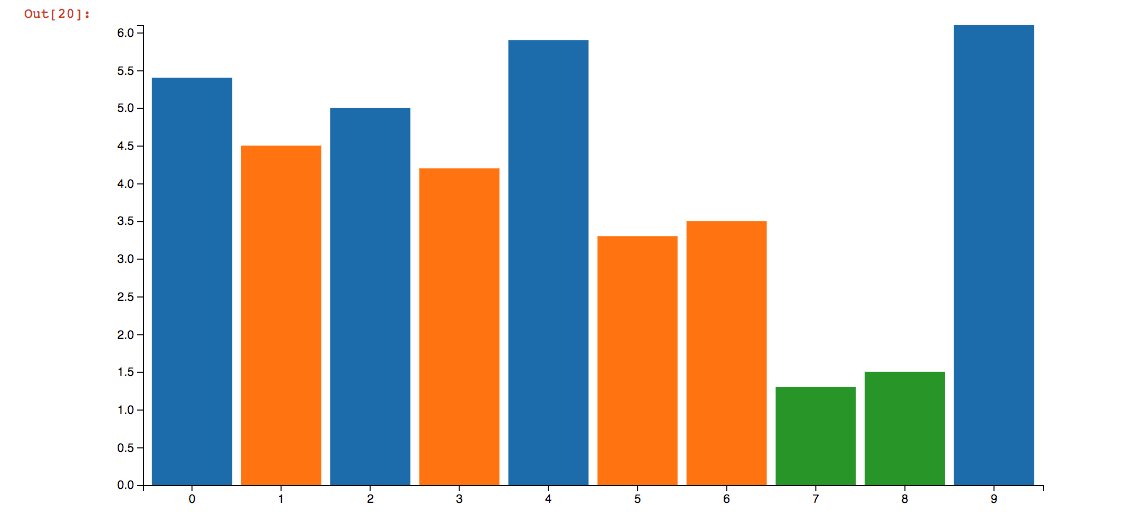
I have recently started doing some data viz work with Jupyter Notebooks. The specific requirement has been getting data from Spark into D3 and using Jupyter is a quick way to do that as it has robust pyspark support. Continue reading “D3 v4 in Jupyter Notebooks”
Category: D3
Peak Rationality
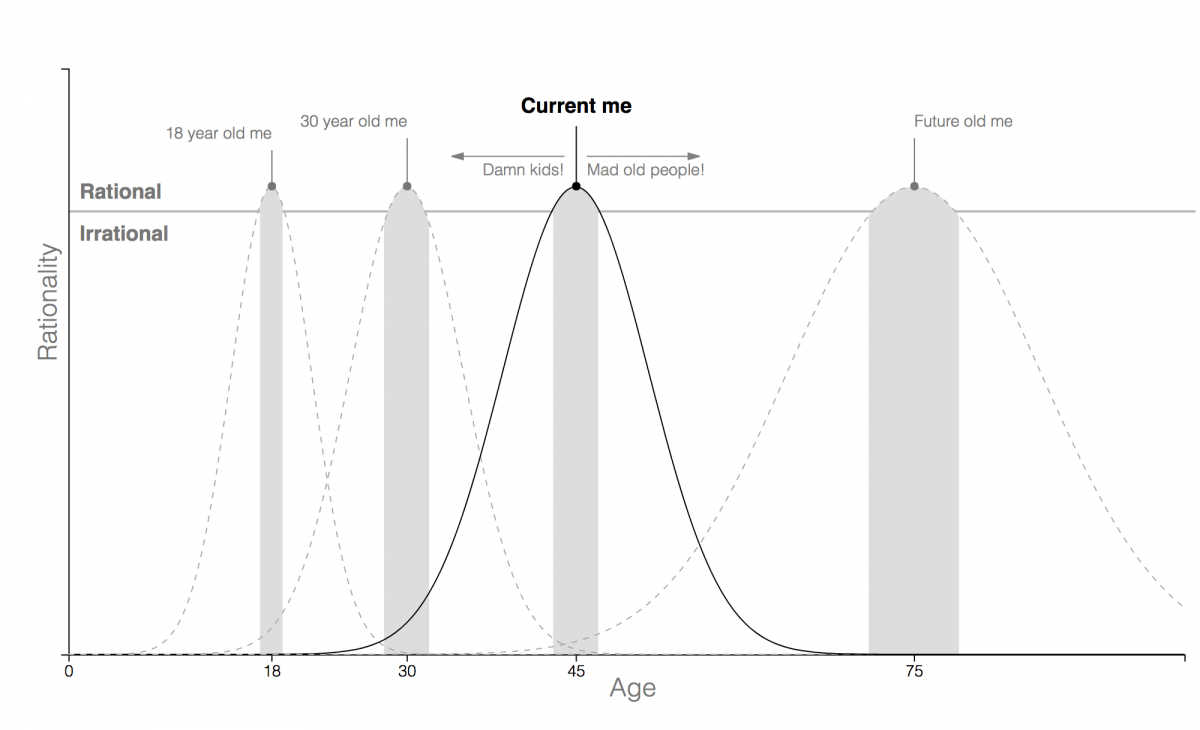
This is the first of a series of semi-weekly visualisations. “Semi-weekly” in this case is ambiguous, like bi-weekly is, so like whenever. It will be depictions of a concept or thought (or even actual data) when time and inspiration coincide. Continue reading “Peak Rationality”
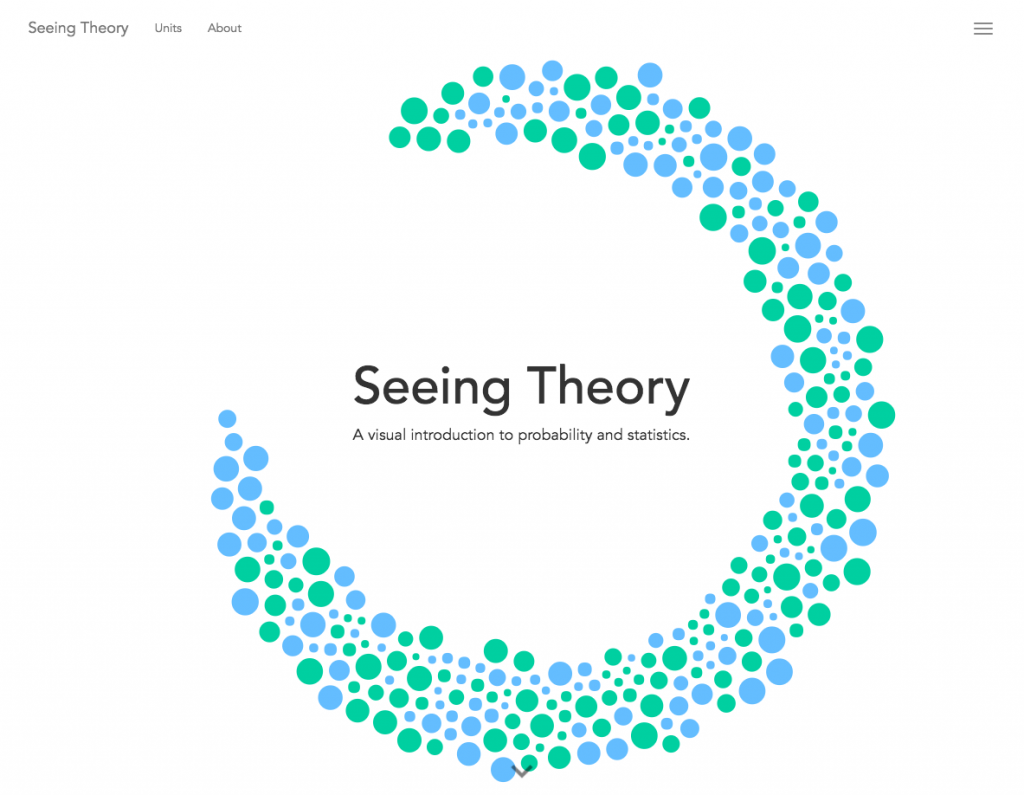
Seeing Theory

Not a lot to say, this is just really awesome work. If you have ever studied statistics and wanted a better visual explanation, go here. And D3 based too!
One Year of Comrades Training
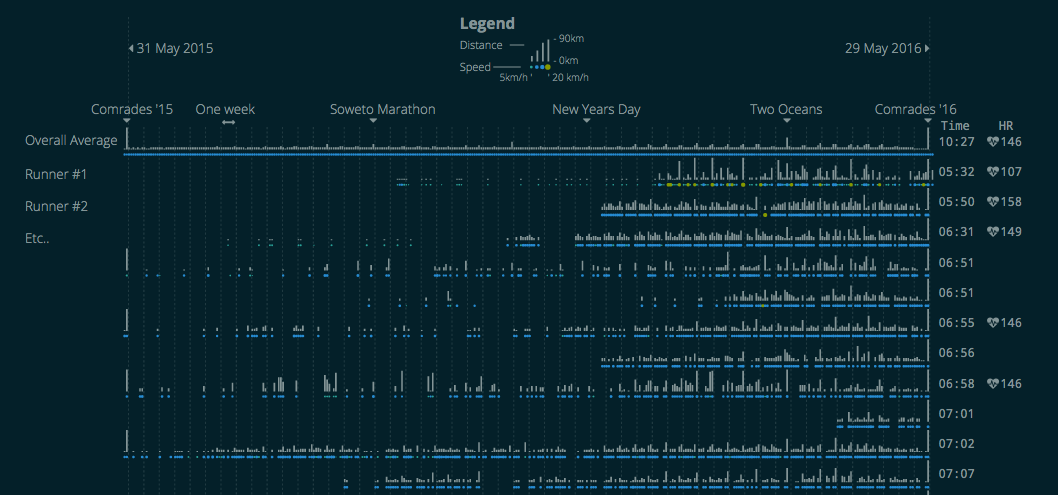
On a recent job at Discovery to do some analytics for Vitality, I was looking at data that is recorded into their platform as part of their insurance linked wellness program. There are various activities that are tracked as part of the program and a fair amount of it is running data. Given the size of their customer base it’s fair to assume that many of them have run the Comrades Marathon, and I wanted to see what all those runner’s various training programs looked like. Continue reading “One Year of Comrades Training”
Jerry Mander
 Since this is an article about gerrymandering, I thought I’d go with a clever, catchy title like Jerry Mander. Ha! But.. it turns out he is a real guy (pictured on the right) with real crazy hair and has written a book about the dangers of television. He also wrote a book about the flaws of capitalism. I get a sense he is just against things (including combs). This article is actually about the other kind of gerrymandering:
n. The practice of redrawing electoral districts to gain an electoral advantage for a political party.
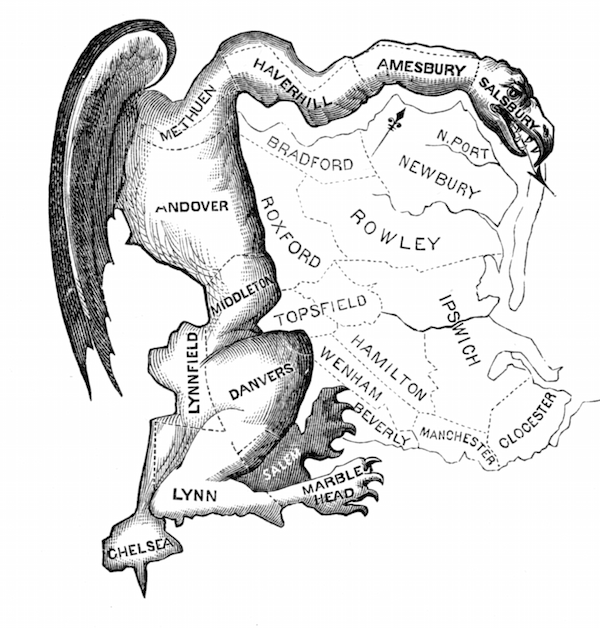
You can read all about gerrymandering online. Its not a new practice. The picture below was published when the term was first coined in 1812.
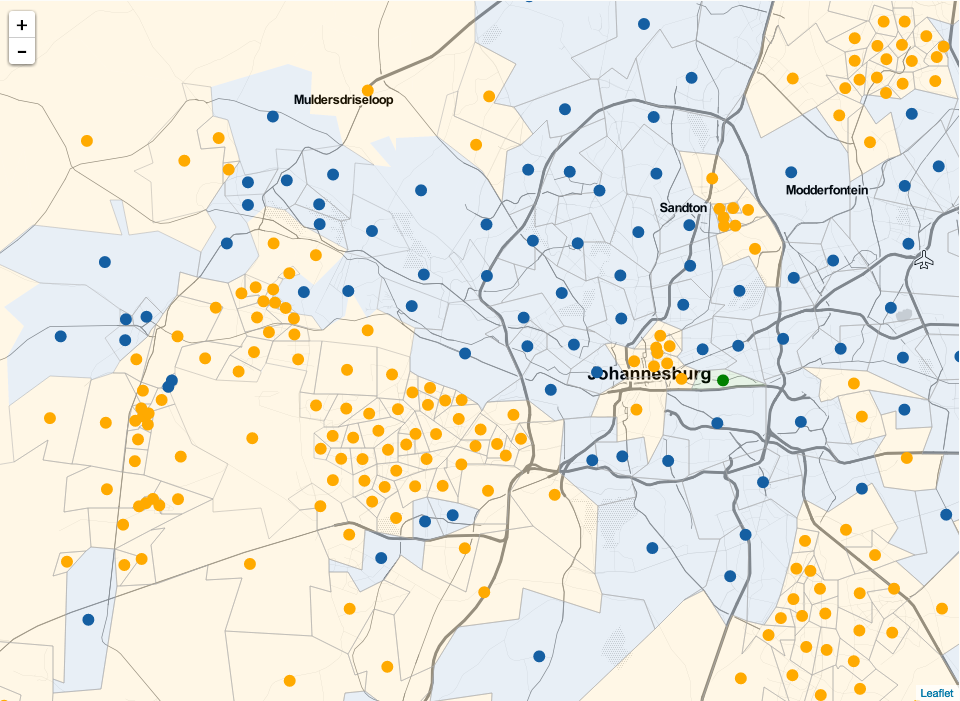
What I’m wanting to show here is how this relates to a South African context. With the next municipal elections coming up soon, its interesting to see how our electoral system implements the notion of voters vs. voting district. Continue reading “Jerry Mander”
Earth, Wind and JavaScript
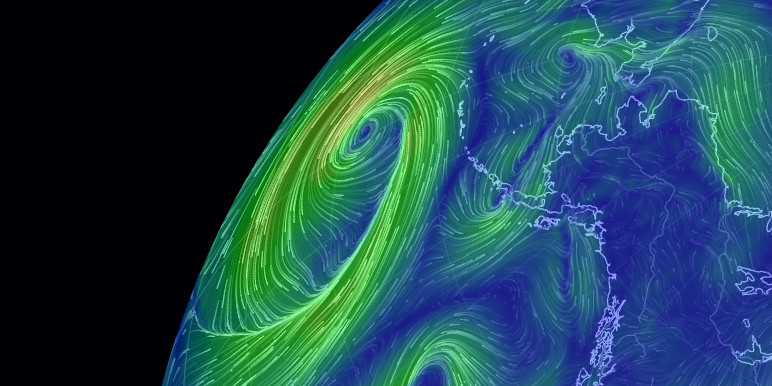
Sometimes I just have to marvel at the amazing things people can do with D3 and JavaScript. Cameron Beccario built “a visualization of global weather conditions forecast by supercomputers updated every three hours”. Continue reading “Earth, Wind and JavaScript”
HTML Music Visualiser using D3
I have always dream of a world where all interactive software would work via the browser. But we still have people clinging to their desktop and mobile apps like some weird guy who believes the best years were when he was still in high school in the 80’s. An all browser world will use one programming language and is platform independent. Mostly.. Apart from when it isn’t. While we have a lot of web stuff now, some components have remained firmly out of reach and one that I have often wanted to experiment with is audio. Enter the <audio> tag. Continue reading “HTML Music Visualiser using D3”
A Timeline of When the World Ended
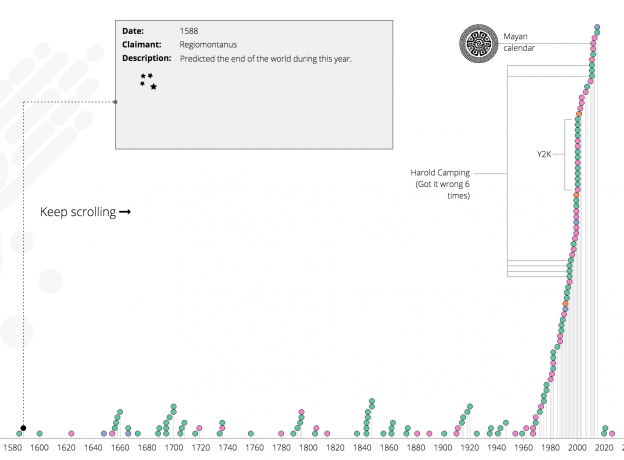
A recent Naked Data newsletter pointed me to this article on wikipedia which gives a list of when the world was predicted to end throughout recorded history. Its a timeline of when the world was supposed to end, who claimed it would and how/why. It is wikipedia, so its as accurate and complete as wikipedia can be. I figured it would be a nice thing to see on an actual timeline, so here we have it. Continue reading “A Timeline of When the World Ended”
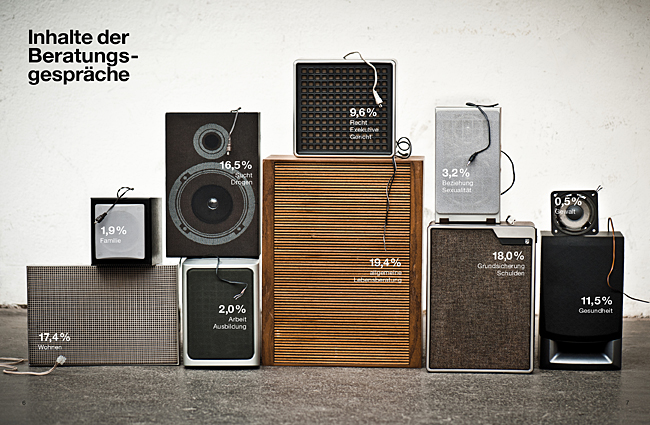
Physical Infographics
These IRL, physical infographics are awesome. I think we all need to spend less time with D3 libraries and more time arranging our furniture into graphs.
Yet Another IP Attack Map

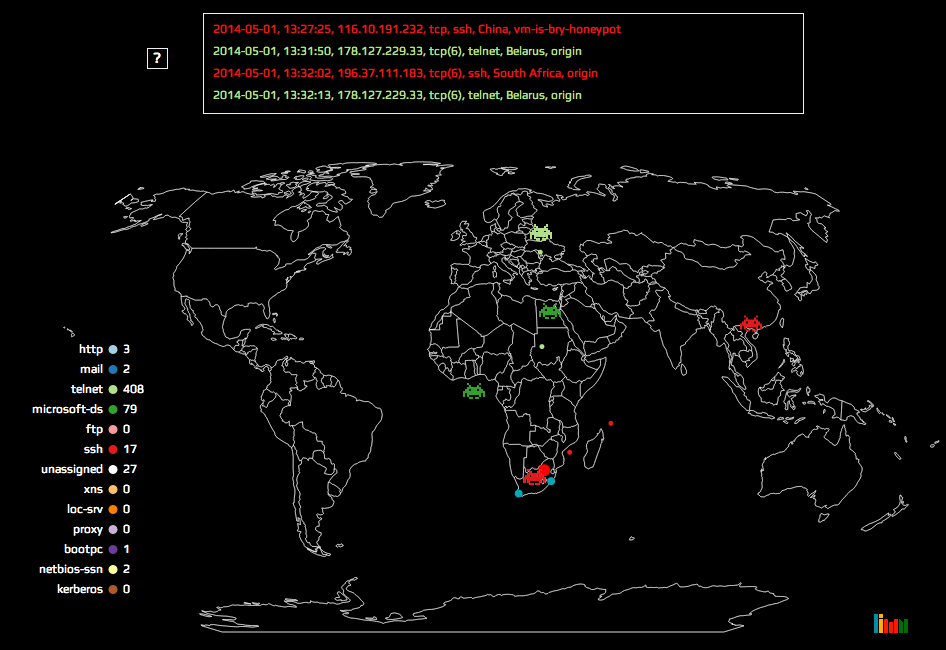 Attack maps are becoming a more common data visualisation with some great examples that have been doing the rounds here, here and here. I tackled a similar project that has been put on hold for now, but I really enjoyed making the map and I think its a fun interpretation. The version I put up shows the attack data for 1 May 2014.